


Only 3 ETFs You'll Ever Need for US Equities Exposure + Kicker ETFs
XLK, SPGP, SCHD, JEPQ, SMH & More

This was going to be a paid article but since I am still working through some formalities to set up my paid subscription, I am publishing this article for free. Markets are just turning into a seasonally strong period and I didn’t want to hold off on sharing this article any longer.

This is the 3rd article in my retirement series. You can check out the rest here (strongly recommended, some life changing things in those articles).
This article also borrows heavily from one of my older articles titled: The Ideal US Equity ETF Portfolio.
Based on the research in The Ideal US Equity ETF Portfolio, I picked $XLK, $SPGP & $SCHD as the core pillars of my retirement account.
Background:
In August this year, I learned that in 8 years my Vanguard retirement account had made me a total return of 25.66%. After this realization, I moved my 401K to a Traditional IRA and I now manage my own account. I think that I can more than double my retirement income (as compared to what Vanguard would have given me) by investing in the ETFs I am sharing in this article.
I have now completed transitioning my 401K to a self managed Traditional IRA. In this article, I am going to share with you exactly what is in my retirement portfolio beyond the 3 tickers mentioned above.
Additionally, I will share with you a few ‘kicker ETFs’ which could be a potential 4th ETF to either bring more stability, broader coverage or more juice, depending on what you are looking for.
All ETFs benchmarked against $SPY and each other.
Average Vs Alpha:
Average portfolio’s will give you average returns. Said in a different way, if you hold $SPY or $VOO or any other broad index, it, by definition, will give you average returns. So if you are looking to “more than double your retirement income”, you have to pick more concentrated ETFs to hit that goal. However, you can be concentrated in the best performing ETFs and yet achieve a high level of diversification. I’ll talk more about this in the fund overlap section below.
Data & Charts:
Here is a Seeking Alpha link to compare performance across all the ETFs mentioned in this article across various timeframes. (Make sure to switch to ‘Total Return’, it defaults to ‘Price Return’).
I will be referencing data from this section in later sections, so feel free to move around.
Here is a chart I created that gives you a snapshot of returns across all ETFs I compared across all time frames (Data pulled on October 29th, 2023 from Seeking Alpha):
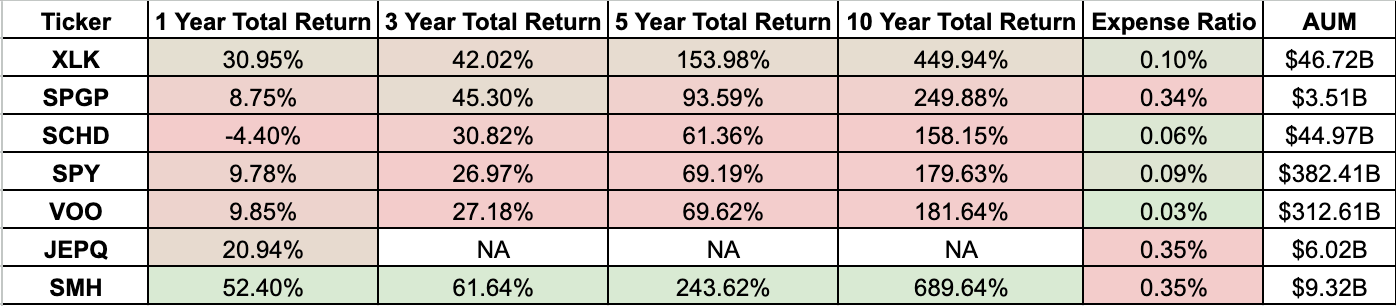
Here are Total Returns based on time frame - JEPQ only features in the 1 year chart as it was launched in May 2022:
1 Year:

3 Year:

5 Year:

10 Year:

Top 3 Pick: Growth - XLK 0.00%↑
I don’t think I need to explain why technology is important, almost everyone alive understands the impact technology has had on our lives. Technology is essential, it is a deflationary force that improves our lives many times over. It underpins everything we do and that is not going to change.
A lot of technology companies are also software only or have a larger concentration of software revenue which is often easier to scale and has higher margins. I believe that this makes Tech and particularly software companies great investments.
Technology is going to continue to remain a key lever for humanity and will only increase its dominance. I don’t see any scenario apart from a total annihilation of our way of life, in which Tech’s value and importance to us goes down.
Across all the ETFs that I have looked at over the years, none beats $XLK in terms of total return (with the exception of $SMH & other semiconductor ETFs, more on that later).
If you look at the performance right now (with the exception of $SMH), $XLK has delivered better total return across all other ETFs we are comparing to including $SPY. However, $SPGP outperformed $XLK in the last 3 years by a small margin.
Fund Highlights:
The Index seeks to provide an effective representation of the technology sector of the S&P 500 Index
Seeks to provide precise exposure to companies from technology hardware, storage, and peripherals; software; communications equipment; semiconductors and semiconductor equipment; IT services; and electronic equipment, instruments and components.
4 Year Average Yield: 0.92%
Dividend Growth 5 Yr (CAGR): 7.75%
Expense Ratio: 0.10%
This is a low cost way of getting exposure to the cream of the market.
$XLK Top 10 Holdings:

Microsoft & Apple alone make up 47% of its holdings. Notice no Alphabet and Meta in the top 10? I appreciate that. I’ll write why soon, follow me to keep up.
Top 3 Pick: Growth + Value: SPGP 0.00%↑
I foreshadowed $SPGP earlier as the only ETF that beat $XLK on a 3 year time frame (with the exception of $SMH).
$SPGP is a GARP ETF. GARP stands for Growth At Reasonable Price. Again it is self explanatory as to why having such an ETF in your portfolio is a good idea, specially in the current environment where there is so much dispersion in the market and stock picking is key. Companies that are growing with cash flow and profits are crushing the companies that are either not profitable or overpriced. The ETF filters for growth, value and quality.
Fund Highlights:
The Invesco S&P 500 GARP ETF (Fund) is based on the S&P 500 Growth at a Reasonable Price Index (Index).
The Fund will invest at least 90% of its total assets in the component securities that comprise the Index.
The Index is composed of approximately 75 securities in the S&P 500® Index that have been identified as having the highest “growth scores” and “quality and value composite scores,” calculated pursuant to the index methodology.
The Index constituents are weighted based on their growth scores.
The Fund and the Index are rebalanced and reconstituted semi-annually.
4 Year Average Yield: 1.04%
Dividend Growth 5 Yr (CAGR): 24.28%
Expense Ratio: 0.34%
The Expense ratio is on the higher side but I believe that the nature of the ETF is such that it requires more active management and the cost is therefore justified.
$SPGP has delivered the second best return in all time frames (except 3 years where it was the best performer) (not including $SMH).
$SPGP has broad coverage with ~28% of the ETF invested in energy, ~19% in IT, ~14% in Materials and more.
$SPGP Top Holdings:

Top 3 Pick: Dividend: SCHD 0.00%↑
Mine and everyone else's favorite dividend ETF. I’d be a millionaire if I got a dime, each time someone said they were bullish on $SCHD. This ETF has a cult following of sorts and for good reason.
However, $SCHD has been in a bit of trouble lately. It has delivered the worst return in all time frames, except 3 years where it beats $SPY. A stock’s performance would look bad across all time frames if the measurement is taken when the stock is down to an unusually low price owing to a transitory macro event and not because of a secular story or fundamentals of the ETF.
The reason $SCHD is struggling in this environment is because $SCHD’s 4 Year Average Yield is 3.43%. The 10 year treasuries are yielding 4.84%. So if you are in it for the income, you can get a much higher yield right now, risk free backed by the U.S. Government. So if you are of a certain age and don’t have a lot more time left in the stock market, yes, by all means, go by treasuries and bonds. But for the rest of us, $SCHD is still the better long term investment. Here is why:
$SCHD gives you capital gains which treasuries and bonds will not. In the last 10 years, $SCHD is up 89% on price alone. So the dividends made up less than half of the total return in $SCHD in the last 10 years.
The risk free interest rate will not stay here forever and will likely go down at some point, however, if you buy $SCHD now, in 10 years, the yield on the capital you invest today could be giving you 7.4% yield (based on last 10 years Yield On Cost for SCHD). I wrote about it earlier this summer.
You have to buy great dividend stocks when they are at a discount, like right now as you can lock in a higher dividend yield. Based on the last dividend payment and Friday’s closing price, SCHD is currently yielding 3.89% (This is assuming they maintain their dividend, which I think they will as they have grown their dividend 11 years in a row). The 4 year average is 3.23%.
Fund Highlights:
A straightforward, low-cost fund offering potential tax-efficiency
The Fund can serve as part of the core or complement in a diversified portfolio
Tracks an index focused on the quality and sustainability of dividends
Invests in stocks selected for fundamental strength relative to their peers, based on financial ratios
4 Year Average Yield: 3.23%
Dividend Growth 5 Yr (CAGR): 13.69%
Expense Ratio: 0.06%
$SCHD Top Holdings:

As mentioned earlier, I think these 3 ETFs can be the core of any high growth US Equity ETF portfolio. Below is a fund overlap analysis to see how diverse these 3 funds are when compared to each other. I will also share ‘kicker ETFs’ at the end of this article that you can use to add more character to your portfolio based on your preferences.
Fund Overlap Analysis:
Comparing All 3 Funds to S&P 500:
$SPGP & $XLK are both subsets of S&P 500 (so 100%), while 54% of $SCHD holdings are also in $SPY
10.8% of SPY's holdings are also in SCHD
12.8% of SPY's holdings are also in XLK
15.0% of SPY's holdings are also in SPGP
Takeaway: The 3 ETFs, each give you exposure to a thin slice of S&P 500, which I argue is the slice you want. It is the cream of S&P 500 based on Growth, GARP and Dividends, IT IS the Alpha.
Comparing XLK to SPGP:
16 overlapping holdings
25% of $XLK's 64 holdings are also in $SPGP
21.3% of $SPGP's 75 holdings are also in $XLK
A few of the overlapping stocks are $QCOM $AMAT $ADBE $AAPL $AVGO
Takeaway: The funds are different from each other but have reasonable overlap with similar weights. Also, since the last time I did this analysis in March 2023, the overlap has increased, which tells me Tech broadly has gotten closer to value in the last 6 months.
Comparing XLK to SCHD:
3 overlapping holdings
4.7% of $XLK's 64 holdings are also in $SCHD
3.0% of $SCHD's 104 holdings are also in $XLK
The three overlapping stocks are $AVGO $CSCO $TXN
Takeaway: The funds are very different from each other. Also since the last time I did this analysis, the overlap is pretty much the same which makes sense as Tech (which is often high growth) and dividend are often not the same stock, not always but often.
Comparing SPGP to SCHD:
10 overlapping holdings
13.3% of $SPGP's 75 holdings are also in $SCHD
10% of $SCHD's 104 holdings are also in $SPGP
A few of the overlapping stocks are $CVX $VLO $EOG $PFE $AVGO
Takeaway: The funds are different from each other and most of these overlapping stocks have a higher weight in $SCHD than they do in $SPGP.
Kicker ETFs:
So as I mentioned, these 3 should give you great returns, with diverse factors which are not too broad. However, here are a few more options to customize your portfolio based on your preferences and market conditions:
Kicker ETF: Broad Coverage & Stability: VOO 0.00%↑
If you still think you want to have broad coverage of the market, $VOO is the best option. Both in terms of Total Returns as well as Expense Ratio.
Fund Highlights:
VOO Invests in stocks in the S&P 500 Index, representing 500 of the largest U.S. companies.
Goal is to closely track the index’s return, which is considered a gauge of overall U.S. stock returns.
Offers high potential for investment growth; share value rises and falls more sharply than that of funds holding bonds.
More appropriate for long-term goals where your money’s growth is essential.
4 Year Average Yield: 1.59%
Dividend Growth 5 Yr (CAGR): 6.1%
Expense Ratio: 0.03%
By adding VOO to your portfolio of XLK, SPGP and SCHD, you will forgo some of your alpha to get more stability and less volatility.
Kicker ETF: Growth & Hedge: JEPQ 0.00%↑
I have written about $JEPQ extensively on my Substack in April 2023 & July 2023. The tldr is that I think $JEPQ is a great hedge as the ETF writes covered call options on the underlying holdings to generate income which goes up if the underlying falls. I also like $JEPQ as it has a natural exit built into it. I often trade in and out of $JEPQ but don’t hold a long term position in it yet. My strategy for $JEPQ has been to sell it when I’m up between 5-10% and continue to dollar cost average if it pulls back. I do not intend to hold $JEPQ through a bull market (as things stand now).
Fund Highlights:
Generates income through a combination of selling options and investing in U.S. large cap growth stocks, seeking to deliver a monthly income stream from associated option premiums and stock dividends
Seeks to deliver a significant portion of the returns associated with the Nasdaq 100 Index with less volatility
Constructs a long equity portfolio through a proprietary data science driven investment approach designed to drive portfolio allocations while maximizing risk-adjusted expected returns
1.5 Year Average Yield: 7.81% (Launched in May 2022)
Dividend Growth 5 Yr (CAGR): NA (Launched in May 2022)
Expense Ratio: 0.35% (Launched in May 2022)
There is not enough data for $JEPQ to conclusively say if it deserves a long term position in any given portfolio (beyond a hedge). Covered call options by their nature return lower than the underlying in a bull market. However, if you are looking for growth, income (dividend) along with downside risk protection, $JEPQ is the best instrument I know of.
When compared with Nasdaq 100, $JEPQ will usually not do well but for most investors the benchmark is $SPY and $JEPQ has delivered 2x better returns than $SPY in the last year. My second article in July 2023 tried to answer this exact question: Is $JEPQ Better Than $SPY?
By adding JEPQ to your portfolio of XLK, SPGP and SCHD, you will add some downside protection to your portfolio without sacrificing a lot of growth. And as mentioned earlier, JEPQ is each to get in and out of because of the natural entry and exit the fund creates.
I am skeptical of $JEPQ still, there is not enough data and such ETFs have not delivered great returns in the long term. It is the most unproven ETF in this article, in my opinion.
Kicker ETF: Growth, Growth, Growth: SMH 0.00%↑
This whole article, I’ve been teasing $SMH, saying things like: $XLK is best (except $SMH), $SPGP is best (except $SMH), well that’s because $SMH has delivered staggering results over the last decade. While $XLK, our best performing ETF delivered ~379% total return over the last decade, $SMH delivered ~576% total return over the last decade. For context $SPY returned ~133% (All Total Returns).
That is the scale of outperformance that $SMH has delivered and there is good reason for it and I honestly think it continues, in fact it might still be early for Semiconductors.
Semiconductors are in everything including your refrigerator, your toothbrush, your car keys, you can see where I am going with this. And we are only going in one direction on this, more and more semiconductors. Obviously these are the dumber chips when compared to the kind of chips that Nvidia is making but it drives the point home. Our world is becoming more and more digital and Semiconductors are the muscle behind the compute, it’s kind of the digital Oil, the digital picks and shovels.
So if, like me, you have a high risk appetite and can stomach high volatility then, adding $SMH to your XLK, SPGP and SCHD portfolio will supercharge your returns in a bull market and pull back aggressively during bear markets.
What Does my IRA look like:
Before I get into the numbers, I want to clarify that my intention is to put most of my money in $XLK $SPGP & $SCHD. However, since the markets were down so much and I had so much cash, I decided to make some shorter term trades. Eventually, I intend to move all my funds to my ‘core’ holdings and get rid of all the trades.
Renewables is one of my core ideas that I think will do in the foreseeable future, so you will see a lot of renewables exposure.
For emerging markets, I am betting on India and might add other regions at some point.
Other secular themes I've invested in are robotics, space & semiconductors.
Real Estate is a trade because I’m building a RE position in my Roth IRA since I don’t have to pay taxes on it.
My IRA Holdings (as of Nov 2nd 2023):
Read as: Ticker - Type of position - Current Holding % (Target Allocation Goal - What I’m doing with the position right now) - Sector
XLK - Core - 12.5% (Goal 12.5% - Will look to increase allocation in the future) - Tech ETF
SPGP - Core - 12.5% (Goal 12.5% - Will look to increase allocation in the future) - GARP ETF
SCHD - Core - 12.5% (Goal 12.5% - Will look to increase allocation in the future) - Dividend ETF
QCLN - Core - 6% (Goal is 2.5% - Looking to Re-balance) - Clean Energy ETF
TAN - Core - 6% (Goal is 2.5% - Looking to Re-balance) - Solar ETF
FSLR - Core - 4.5% (Goal is 1% - Looking to Re-balance) - Solar Stock
SMH - Core - 4% (Goal is 1% - Looking to Re-balance) - Semiconductors ETF
JEPQ - Trade - 3.75% (No Goal, Hedge, Looking to book profit) - Covered Call ETF (Hedge)
ALB - Trade - 3.7% (No Goal, Looking to book profit) - Lithium Miner Stock
BOTZ - Core - 3.5% (Goal is 2% - Looking to Re-balance) - Robotics ETF
ENPH - Core - 3.3% (Goal is 1% - Looking to Re-balance) - Solar Stock
TLT - Core - 3.3% (Goal is 2% - Looking to Re-balance) - Treasuries
VICI - Trade - 3.3% (No Goal, Looking to book profit) - Real Estate Stock
GLPI - Trade - 3% (No Goal, Looking to book profit) - Real Estate Stock
RKLB - Core - 2.9% (Goal is 1% - Looking to Re-balance) - End to End Space Company Stock
INQQ - Core - 2.9% (Goal is 2% - Looking to Re-balance) - India Tech ETF
NVDA - Core - 2.9% (Goal is 1% - Looking to Re-balance) - Semiconductor Stock
EPI - Core - 2.8% (Goal is 1% - Looking to Re-balance) - Broad India ETF
AAPL - Core - 2.5% (Goal is 1% - Looking to Re-balance) - Tech Stock
MSFT - Core - 2.2% (Goal is 1% - Looking to Re-balance) - Tech Stock
TSLA - Core - 1.6% (Goal is 1% - Looking to Re-balance) - Tech Stock
AMD - Core - 1% (Goal is 1%) - Tech Stock
BITX - Trade - 1% (Goal is 1%) - 2x leveraged Bitcoin ETF
SMCI - Trade - 1% (Goal is 1%) - Semiconductor Stock
ASML - Core - 1% (Goal is 1%) - Semiconductor Stock
AVGO - Core - 1% (Goal is 1%) - Semiconductor Stock
Borrowed Conviction Rarely Works
Past performance is no guarantee of future results.
The ideas discussed in this article should not be constituted as investment advice.
I reserve the right to change my mind if the facts change.
Disclosure: We own positions in some/all of the tickers mentioned in this article.