


Rolling Recession/Bear Market Visualized
Are We In New Bull Market?

We are experiencing a Fed induced, rolling recession that started in February 2021 and continues today.
In this article I will break down the performance of each sector and visualize the rolling recession we hear about so often these days. My primary argument is that markets are a forward looking discounting mechanism and it already accounted for the mild rolling recession in 2022. I will also compare the current state of markets with historical recessions and pull insights which should help us better understand where we might be in the market cycle.
Rolling Recession:
The concept of a “rolling research” was introduced by Ed Yardeni, veteran market watcher and founder of Yardeni Research, who believes the U.S. is already experiencing a rolling recession, during which certain sectors of the economy contract while others continue to expand.
I have had a debate with the naysayers out there who’ve been saying that we’re going to fall into a recession, and they have been saying that for quite some time, The recession has yet to show up in terms of an economy wide recession. I’ve been arguing that the economy actually has been a recession, it’s just been a rolling recession, hitting different sectors of the economy at different times.
- Ed Yardeni, Source: Barron’s
Simply put, a rolling recession is when some industries contract and suffer job losses, while others continue to grow, leaving the overall GDP growth positive, but low by historical standards.
What is a bear market, technically?
A 20% drop in stock price is considered a bear market.
Bear markets and Recession are not the same. Recession refers to what is going on in the actual economy. Bear markets refer to the stock market and performance of stocks.
Stocks are a forward looking discounting mechanism which tends to front run the economy by 6 to 12 months minus any exogenous event (ig: Covid 19). This is because markets trade on forward estimates given by companies and analysts build their models based on the company’s guidance. Since these estimates usually range from between 6-12 months, markets trade based on future anticipation of how the economy will perform.
Quick Timeline of how the bear market unfolded over the last 2.5 years:
In Feb 2021, the bear market started with unprofitable ultra expensive growth stocks (ig: $FVRR $QS $CRSP) followed by a broader sell off in the summer of 2021 which started with Communication Services.
In the H2 2021, CPI (Inflation) started ramping up, from 5.4% in Sept 2021 to 9.1% in June 2022 (Source). This led to a further broadening of the sell off in Q4, 2021.
In Feb 2022, Russia invaded Ukraine (which I believe to be the primary reason why we saw inflation spike to 9.1% a few months later in June). You will see in the visual below, most sectors sold off in Q2 and Q3 2022.
In August 2022, at the Federal Reserve Annual Jackson Hole Economic Symposium, Fed Chair Jerome Powell said that we would have to endure ‘some pain’ to get the inflation genie back in the bottle which led to a final flush in October 2022 and Dec 2022, which I think was the bottom for this cycle.
Since stocks are forward looking, the market saw the mild economic weakness on the horizon and corrected in anticipation. We are now re-accelerating with earnings expectations going back up and expectations that inflation is going to continue to come down and the Fed will cut rates in the next 9 months because of inflation coming down and not because the economy is weak.
2023 Q2 is on track to be the third consecutive quarter of declining S&P 500 earnings. The expectation currently is for another earnings decline in Q3 of -1.5%, after which growth turns positive in Q4 and continues in 2024. In fact, Q3 earnings would be positive had it not been for the Energy sector drag.
Source: Nasdaq
We are in a fed induced recession and the underlying economy is very strong. As a result of this tightening, the Fed now has more cushion to bring in the “Fed Put” as and when necessary. Clearly soft landing is on the Fed chair’s mind. The Fed does not WANT TO tank the economy.
Having said that, with the current geopolitics & elevated interest rates leading to a slowing economy, there are risks. And inflation still needs to continue to come down too. Add to that the fact that it does not matter what you and I think, what matters is where the market’s fear gauge is and that’s what we need to get right. If there is a scare in the markets, it will sell off (as we have been experiencing for the past week).
I am in the camp that the S&P 500 could hit a new high by mid next year, but will it have to go through an additional 20% drawdown to get there? I think not, but it is possible.
That is the summary of the whole article. Below, I will get into details and show you why I think we’ve priced in the weakness and that we are likely in a new bull market which started in Jan 2023.
Sector Breakdown:
All charts below were pulled from Seeking Alpha on October 14th, 2023 - Here is a link for you to follow along.
Tech started going down in Dec 2021 and bottomed in October 2022 - It fell approximately 33% during that period.
However, do you see the lower low it made all the way to the right on the graph?
Tech is what has led us higher.
Is it time for tech to settle down and for the rest of the markets to move up or is tech going to go down further and meet the rest of the sectors?

Consumer Discretionary started going down in Nov 2021 and bottomed in Dec 2022 - Dropped approximately 39% during that period. It is far from making new highs.

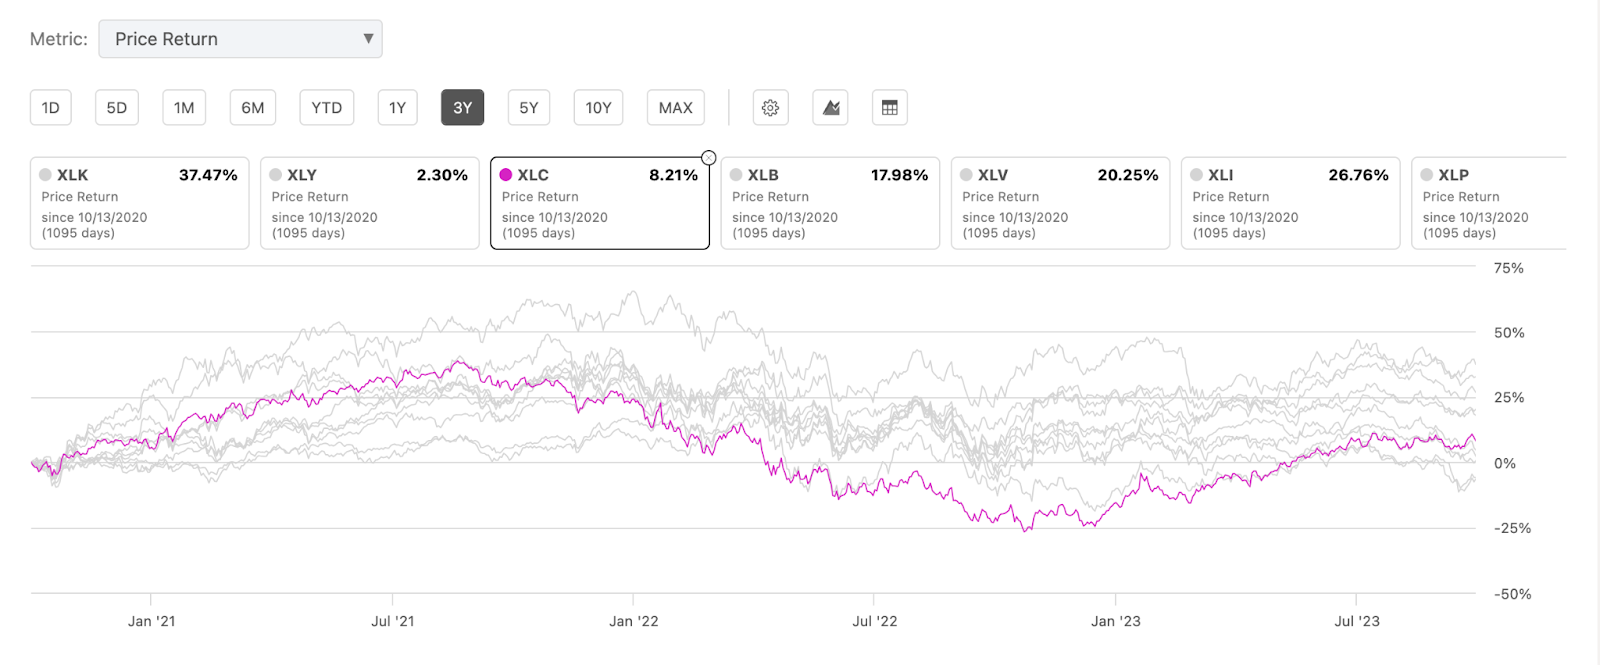
Communication Services topped out in August 2021 and bottomed in November 2022 - Approximately 47% drawdown in that period.
Materials - Dec 2021 to September 2022 - Approximately 25% drawdown.

Health Care peaked in April 2022 and bottomed in June 2022 - a 16% drawdown. Usually a safety trade and you can see that in the graph which is a lot less volatile.

Industrials peaked in Nov 2021 and bottomed in Sept 2022 - a 22% drawdown - Industrials in fact made new highs in July 2023.

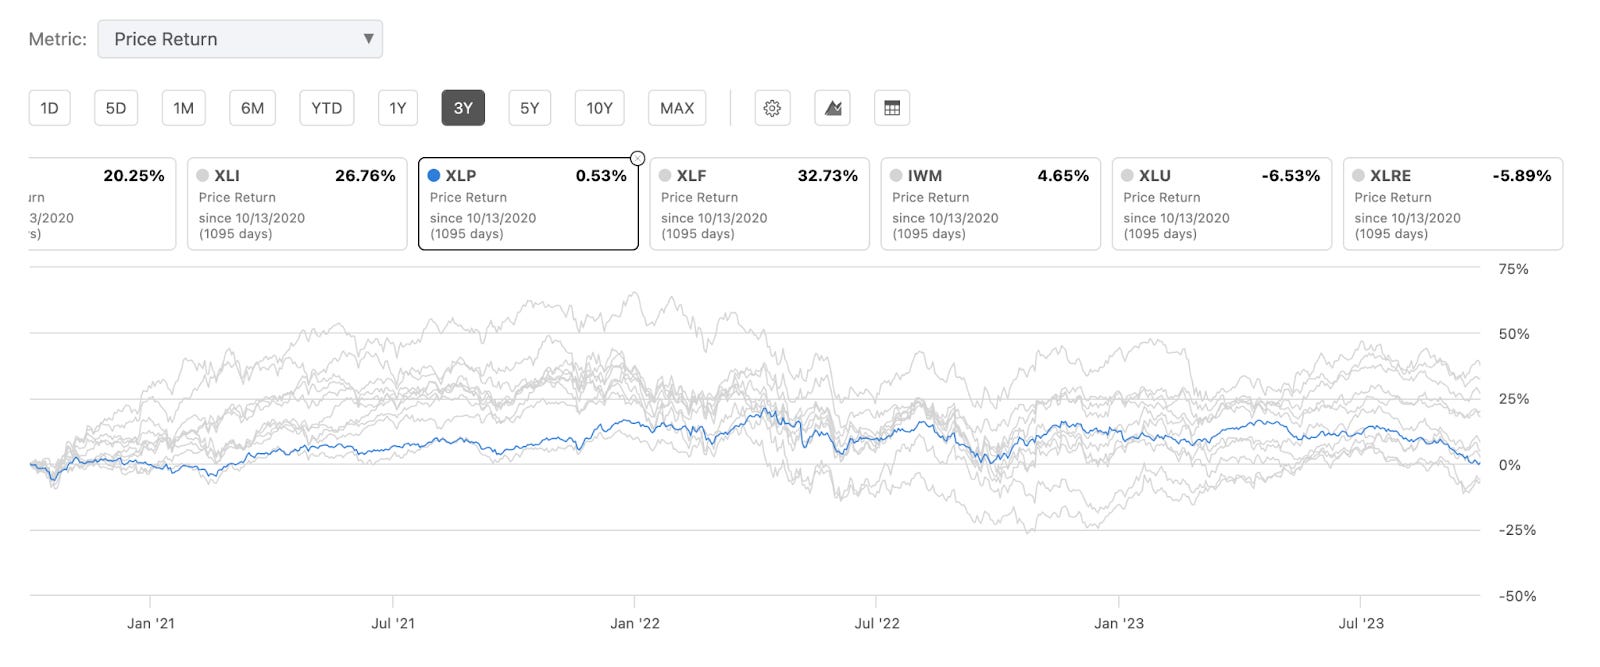
Consumer Staples peaked in April 2022 and bottomed in October 2022, however it is back at those Oct 2022 bottom, literally right now (Oct 14th, 2022) - a 16% drawdown.
Financials peaked in Jan 2022 and bottomed in September 2022, however, it almost revisited that bottom in March 2023 after the SVB collapse ~27% decline.

Small Caps (not an S&P 500 sector) peaked in Nov 2021 and bottomed in June & September 2022, almost back there right now. ~32% decline.

Utilities peaked in Aug 2022 and are still in a bear market right now. ~26% decline.

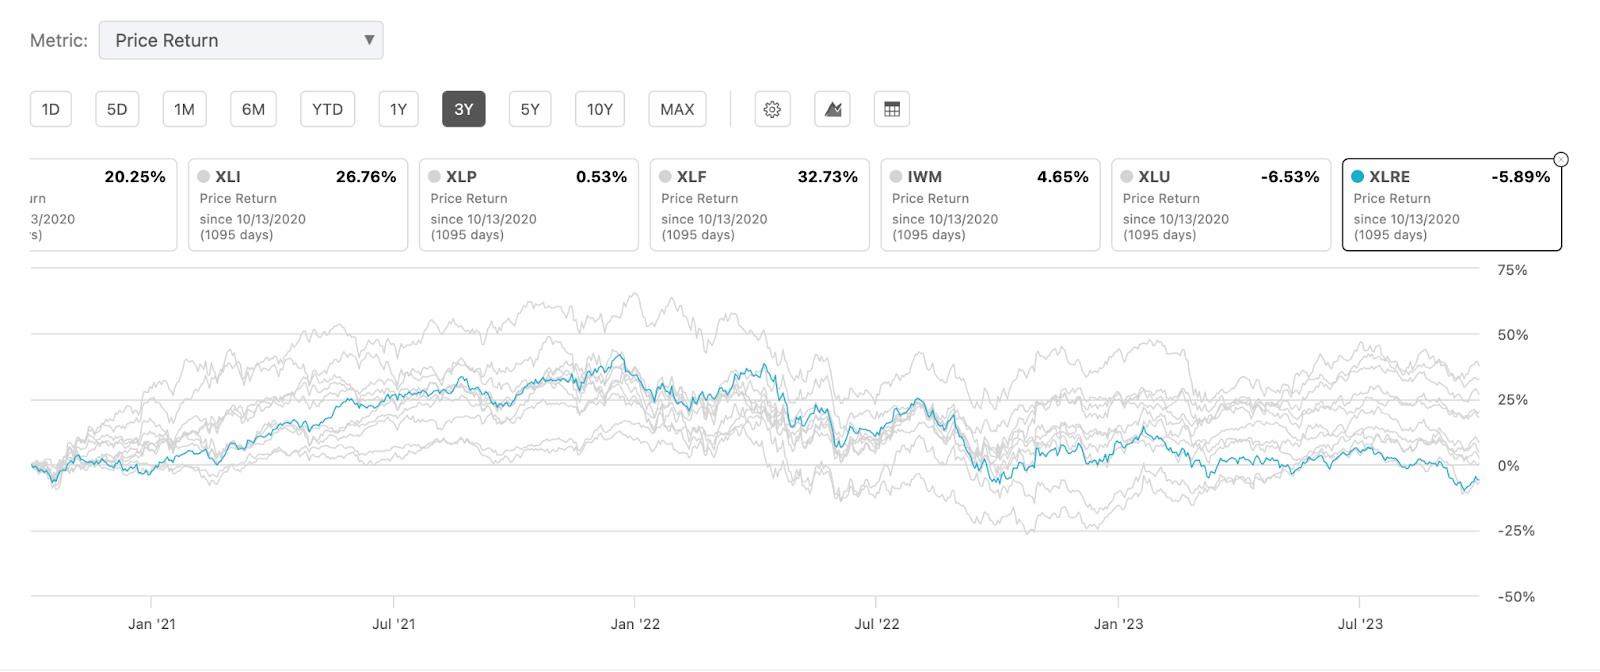
And finally Real Estate peaked in Dec 2021 and is still in a bear market right now ~35% decline.
On the opposite end of the spectrum, Energy has been in a straight up bull market for the last 3 years.

Here is a note from Business Insider talking about how the different sectors seem to be in a recession while others are not:
Housing activity has been on the decline over the past year as mortgage rates remain elevated. Energy prices have also slumped from highs last summer, and manufacturing activity dropped for the eighth-straight month in June, with the manufacturing PMI clocking at 46% last month – close to levels that have traditionally been associated with a recession.
Meanwhile, other areas of the economy have remained buoyant. The services sector was strong over the first half, as American consumers are still spending despite the gloomy economic backdrop. US GDP also expanded 2% in the first quarter.
Source: Business Insider - July 21 2023
Rolling Recession Visual:
Below is a visual to help you see the rolling bear market.
You can see most sectors were in a bear market from Q4 2021 to Q4, 2022
The only sectors that have not gone into a bear market are Health Care, Staples & Energy:
Health Care and Staples both pulled back from peak to trough 16%
Energy has been in a bull market throughout
All other sectors were in a bear market at some point in the last 2.5 years

Sectors Performance Before, During & After a Recession:
Here is one of my favorite pieces of research, compiled by Ned Davis Research Group based on past recessions since 1972. It helps me understand how various sectors have performed in past recessions.

The cleanest patterns I can observe in the chart above, (which is also widely acknowledged on the street) are:
Consumer Staples & Health Care do well when we are in a recession and Materials to a lesser extent (See Blue and Pink) - This makes sense as people still buy food, toothpaste and medicines during a recession.
Consumer discretionary leads us out of recessions, it is the first sector to flip positive (in pink) and continues (in yellow). This also makes sense, people start buying things which they’ve been wanting to as they start having more disposable income, as the economy improves.
Consumer Staples & Health Care flip negative when we are out of the recession. Stock prices have growth anticipation built into them. So as long as we are in a recession, a lot of money is parked in Consumer Staples & Health Care to preserve capital (as they perform relatively well during recessions) and as it becomes obvious that we are coming out of the recession, money moves out of these funds into other sectors which have higher beta.
Higher beta stocks also tend to outperform in bull markets when the economy is in expansion mode and confidence is high, whereas lower beta stocks tend to fare better during recessions.
Source: Investopedia
Are We In A Recession?
Let’s compare past 2.5 Years sector performance data to S&P 500 sector performance during a recession chart.
(Please take note that it is not possible to overlay the two charts on each other because of the nature of a rolling recession, it by definition does not have a defined start date.
Also markets usually look forward 6-12 months but it is not defined if it is 6 or 12 or 9. That too makes it hard to map the two charts directly.
The insights from this section will be messy but helpful. Additionally there are multiple secular stories (which I have noted at the end of this section), that also make it hard to compare head to head.)
_
6 months after the recession starts (2nd Column):
Consumer Staples (5.1), Materials (2.7) and Health Care (5.5) tend to do well in this period.
Comparing that to the rolling recession visual above:
Consumer Staples (-16%) and Health Care (-16%) have done well on a relative basis and have not been in a bear market in the last 2.5 years.
Materials (-25%) did go into a bear market. However, if you see how Materials (2.7) behave 6 months after a rescission starts and compare it to Consumer Staples (5.1) and Health Care (5.5), you will see Materials is relatively worse off but better than other sectors. And that relationship holds.
Based on these two charts, it looks like we are, at the very least 6 months into the recession.
_
6 months before the recession ends (3rd Column):
Staples (4.5) and Healthcare (7.8) continue to outperform. The big switch is in Consumer Discretionary which goes from positive (0.1) to (8.8). Everything else is more of a continuation.
Comparing that to the rolling recession visual above:
Consumer Discretionary flipping positive on the visual would place the “6 months before the recession ends” in Late 2022 - Early 2023 - I would like to warn again, these readings are not clean and will not match completely owing to it being a rolling recession.
_
6 months after the recession ends (4th Column):
We see Staples (-4.8), Healthcare (-6.7) and Utilities (-2.3) flip negative.
We have started to see that in the markets right now:
Even though these sectors outperformed on a relative basis in the last 2.5 months, we have been seeing recent weakness. In the last 1 year, all sectors are positive, except, you guessed it: Staples (-2.86%) and Utilities (-5.96%).
Healthcare is holding up better and is up 4.37% in the last 1 year and does not match the storyline that we could be in the six months after the recession has ended. Maybe we are somewhere in 0-6 months after the recession has ended.
Small caps are also down 0.66% but that is not a sector nor is it in the S&P 500, I added it for context.
Based on this comparison, our current market conditions closely match “with 6 months after the recession ends”.
_
Sectors specific secular stories that could be skewing last 3 year performance:
Energy usually continues to deteriorate during the recession, we are not seeing that. I think that is because we are not in a normal recession, hence the rolling recession: While goods were in recession, services have been booming, continuing to support energy prices. Besides the existence of OPEC+ makes it so that energy is not going to give us a clean read.
Ozempic & Wegovy - The most recent craze of weight reducing GLP-1 drugs has had an outsized impact on Healthcare and Staples.
The Fed's historic rate hikes have impacted traditional safety trades like Utilities, Staples and Real Estate. Interest rates impact Real Estate and Utilities more than it impacts other sectors. Real Estate has widely been acknowledged as being in a bear market & recession for over a year now.
Communications Services and Tech which are usually lower six months after a recession have been performing very strongly in 2023 largely led by AI and strong balance sheets of the Magnificent Seven, which has led them to be a safety trade too.
Bottomline:
All sectors that usually go down in anticipation of economic weakness, have gone through this rolling bear market at some point in the last 2.5 years.
All sectors that tend to do well in a recession and not so much when coming out of a recession, have started to go down in the last few months.
I’d say that based on this analysis, the parts of the recession ended early this year and that we are very close to the end of this rolling recession and likely in a new bull market.
Nasdaq is up ~37% YTD, that does not sound like a recession.
Rolling Expansion:
If we are going into a rolling recession it is only sensible that we roll into an expansion too.
What happens after a rolling recession? Perhaps a rolling expansion as the economic sectors that fell into a recession recover.
Source: Research note by Ed Yardeni explaining rolling expansion.
For example, when we first went into lockdown in 2020, there was a surge in people buying laptops, tablets and phones. Guess what, travel is starting to slow down a little bit & PCs are making a comeback.
A Fed Led Recession
The current issue for the stock market is so ‘first world’, oh! The economy is too strong.
It’s not like the economy is struggling to grow or people are unemployed, no! We are doing too well, that is the problem. Ridiculous.
Let’s take a look at where we stand today.
Some parts of the economy are slowing down while others are re-accelerating, I don’t see a slump or a crash..
Global supply chains disrupted by Covid-19 have largely normalized.
The Fed has managed to pull the inflation down to a relatively manageable level.
Unemployment is at 3.8%
The Fed has raised interest rates, giving them more cushion now than it has had in over 15 years. So if something were to break, they have room to cut, giving them more control.
I think the Fed Put is alive and well and we saw some of that during the regional bank crisis in March 2023.
If there is FUD in the market and markets start selling off, then inflation should come down more rapidly. And because the Fed will have at that point, most likely, achieved its primary goal of slaying inflation. No reason to hold the economy hostage once that is done. However, in this path, there is a risk that we could revisit the October 2022 bottom.
The Federal Reserve Act mandates that the Federal Reserve conduct monetary policy "so as to promote effectively the goals of maximum employment, stable prices, and moderate long-term interest rates.
Source: FederalReserve.Gov
The main point that I am trying to make here is that the federal reserve does not want to tank the economy, they want maximum employment, stable prices, and moderate long-term interest rates. It does not just say ‘Stable Prices’ only.
All the Fed is trying to do is bring down inflation, while trying to not lose too many jobs, so that they can eventually bring down interest rates to a moderate level.
I stress on the fact that this is a Fed induced rolling slow down/recession with the Fed put intact but it is not without risk.
I also happen to believe that good news is good news and should be treated as such.
The Fed Is Done Raising Rates:
As inflation continues to fall, even when the Federal Reserve is on pause and does not raise rates further, the Real rates continue to rise. This leads me to believe that as long as inflation does not re-accelerate (which I don’t think it will, details below), the Fed is done raising rates.

Link to Source
Even though the Federal Reserve is not raising rates, they continue to do Quantitative Tightening. This too contributed to my belief that the Fed is done raising rates.
Here is how the Fed’s Balance Sheet looks:

Link to Source
The last rate hike was in July 2023! We’ll complete 3 months of pause by the end of next week.
Inflation is coming down:
Add to all of this the fact that inflation is coming down and the Fed is winning the battle against inflation. So if that continues to happen, then no reason to continue to tighten monetary policy or even hold it here.
Please take a look at the chart below and tell me how inflation is not coming down?

Link to source: U.S. Bureau of Labor Statistics
Almost all of the Inflation is owing to Shelter.

Link to source: U.S. Bureau of Labor Statistics
If we take shelter out, then inflation is at 2% already.

Source - CNBC: YouTube Video
And shelter is coming down too, it’s just not showing in the CPI data because of the way the Fed calculates housing/rents (WSJ: No One Pays Owners' Equivalent Rent). Shelter has been falling for months and if the more high frequency data is taken into consideration, the fed is at or very close to target:

Source - CNBC: YouTube Video
Energy is another reason people think will lead to sustained higher inflation.
The energy CPI chart actually looks pretty good, minus the uptick.

Link to source: U.S. Bureau of Labor Statistics
This tweet from Larry Summers did not help:
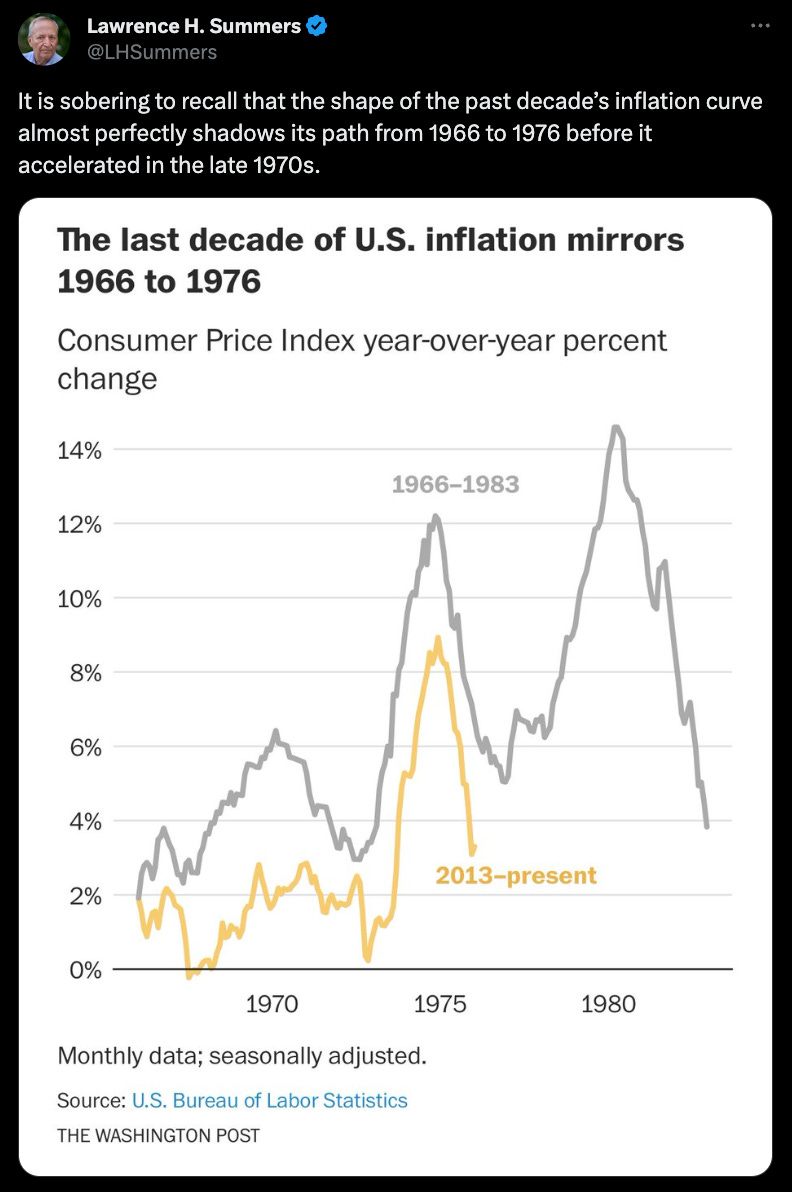
This chart was widely criticized because it does not take into consideration the specifics of US’s dependence on the Middle East for Oil in the 70s.
Yes there is a small uptick recently but I don’t think we will see a 1970s like spike in energy prices because that spike was led by the 1970’s Oil Embargo imposed against the United States by OPEC in retaliation for the U.S. decision to resupply the Israeli military and to gain leverage in the post-war peace negotiations, you can read more about it here.
To his credit, Larry only shared the chart and did not make a prediction that we are destined to follow the same path but I think this leads to unnecessary fear in the markets.
Sadly, you could argue we are in a similar position today with the recent Hamas attack on Israel but I would argue ‘maybe not so much’ for a few reasons:
The United States produces more oil than any other nation and is a net exporter. So we are not hostage to OPEC as much as we were in the 1970s.

Source: Our World In Data
Add to that the increase of Natural Gas production by the U.S.

Source: Our World In Data
El Niño
If we have a warm winter, this pressure on oil prices will ease - just like it did last year. And with the current forecast for El Niño, it’s likely we will be getting another warm winter.
It’s official: “El Niño conditions are present and are expected to gradually strengthen into the Northern Hemisphere winter 2023-24,” the National Weather Service reported on June 8, 2023.
El Niño is the warm phase of the Pacific Ocean’s temperature cycle, and this year’s El Niño is poised to be a big one, sending shock waves into weather patterns around the world.
Source - Paraphrased: Vox Media News Article - June 8, 2023
Transition to Green Tech
The transition to green tech which I don’t think will have a large enough impact to offset Oil enough to make a large enough dent in the current fight against inflation but it is a deflationary force which will keep reducing demand for oil as time passes. Overall oil consumption is still going up though. At some point oil usage will start declining YoY, maybe not for another decade but one day it will, it better.
Risk:
Inflation: Inflation needs to continue to come down.
High For Longer: Even if the Fed does not increase rates further and keep them where they are, it will put pressure on the economy: As Inflation comes down, the Real Rates continue to rise. Quantitative tightening is further adding to the pressure. However, in the past the economy has done well with higher interest rates.
Higher For Longer: The Federal Reserve could also over tighten, even though they don’t intend to. This is owing to the long and variable lags of monetary policy. They often don’t know how rate increases made today will affect the economy 12-18 months out making it very hard.
Geopolitics: J. P. Morgan CEO Jamie Dimon recently said, “Most dangerous time the world has seen in decades” and I think he is squarely focused on Geopolitics. This is the most unstable time in my lifetime with Ukraine-Russia & Israel-Palestine at war and China-Taiwan-US seemingly preparing for one. The world feels more divided than it has in the last few decades. Misinformation is rampant, trust in public institutions is waning. So yes, the geopolitical risk is elevated and is likely the biggest risk unless calmer heads prevail.
China is not doing well, especially its property sector. China is now the 2nd largest economy in the world and if its property sectors fail, then it is bound to have ripple effects throughout the global economy.
Slowdown ahead: While I make the case for rolling recession, rolling bear market, inflation falling and earnings re-accelerating, it is undeniable that there is anecdotal evidence of a slow down in some sectors but the same is not visible in the data yet (which continues to be very strong). This lack of slowdown has surprised economists the entire year as they keep pushing out their recession forecast. So, it is possible that it does not come in Q1, 2024 either.
I think the Fed’s historic rate hike has finally started to show some impact and we continue to slow down.
So, inflation needs to continue to come down, geopolitics needs to be contained, the Fed and the markets need to remain calm. All things that can go wrong but I am betting they won’t. However, if they do, then that MIGHT be a really good buying opportunity.
Summary:
CPI (Inflation) is currently at 3.7% and the trend is lower.
The Federal Reserve last raised interest rates in July 2023 and it is currently between 5.25% and 5.50%.
We've experienced a rolling bear market and a rolling recession since Feb 2021.
The brunt of the bear market was in H2 2022. Market slowed down and corrected until Q4 2022, anticipating the real slowdown to hit in 2023, reaching max pain by Q4, 2023, and then accelerate into Q1 2024 (earnings estimates have started going up). Markets will continue to trade based on forward guidance and expected earnings over the next 6-12 months, as it has always done.
Most important assumption being that inflation continues to come down, pushing real rates higher. Given that The Fed is also doing Quantitative Tightening and reducing its balance sheet, it can start cutting interest rates to normalize interest rates by mid-2024 and we would have achieved the elusive soft landing.
Markets don’t need the real rate cuts to start moving higher, it is a forward looking discounting mechanism. Just a whiff of a pause (which I think has happened) is enough. A cut will really confirm that we are in a new bull market, as long as it is done for the right reason, which is inflation is under control and not because the economy is tanking.
However, if inflation does not come down quickly enough, then it is a race against time. Some sectors will continue to do well, while some will continue to be challenged. The more interest rate sensitive sectors, which are already feeling the pain, will continue to get worse (Home, Car, Solar, etc…). However as time passes, if this issue is not resolved, it will spread to other industries too leading to a full blown recession.
I don’t think this is what’s going to happen but it is possible.
Borrowed Conviction Rarely Works
Past performance is no guarantee of future results.
The ideas discussed in this article should not be constituted as investment advice.
I reserve the right to change my mind if the facts change.
Disclosure: We own positions in some/all of the tickers mentioned in this article.