The end of Fossil Fuels & rise of Renewables
When will renewable energy start cannibalizing Fossil Fuels on an absolute basis?
So we’ve all been hearing about renewable energy, especially wind and solar and how they are growing at a breakneck speed. So at some point the consumption of oil and other fossil fuels should start going down on an absolute basis, right?
It hasn’t happened yet because even though we are increasing our energy coming from renewable sources at a rapid clip, our overall energy consumption is growing even faster.
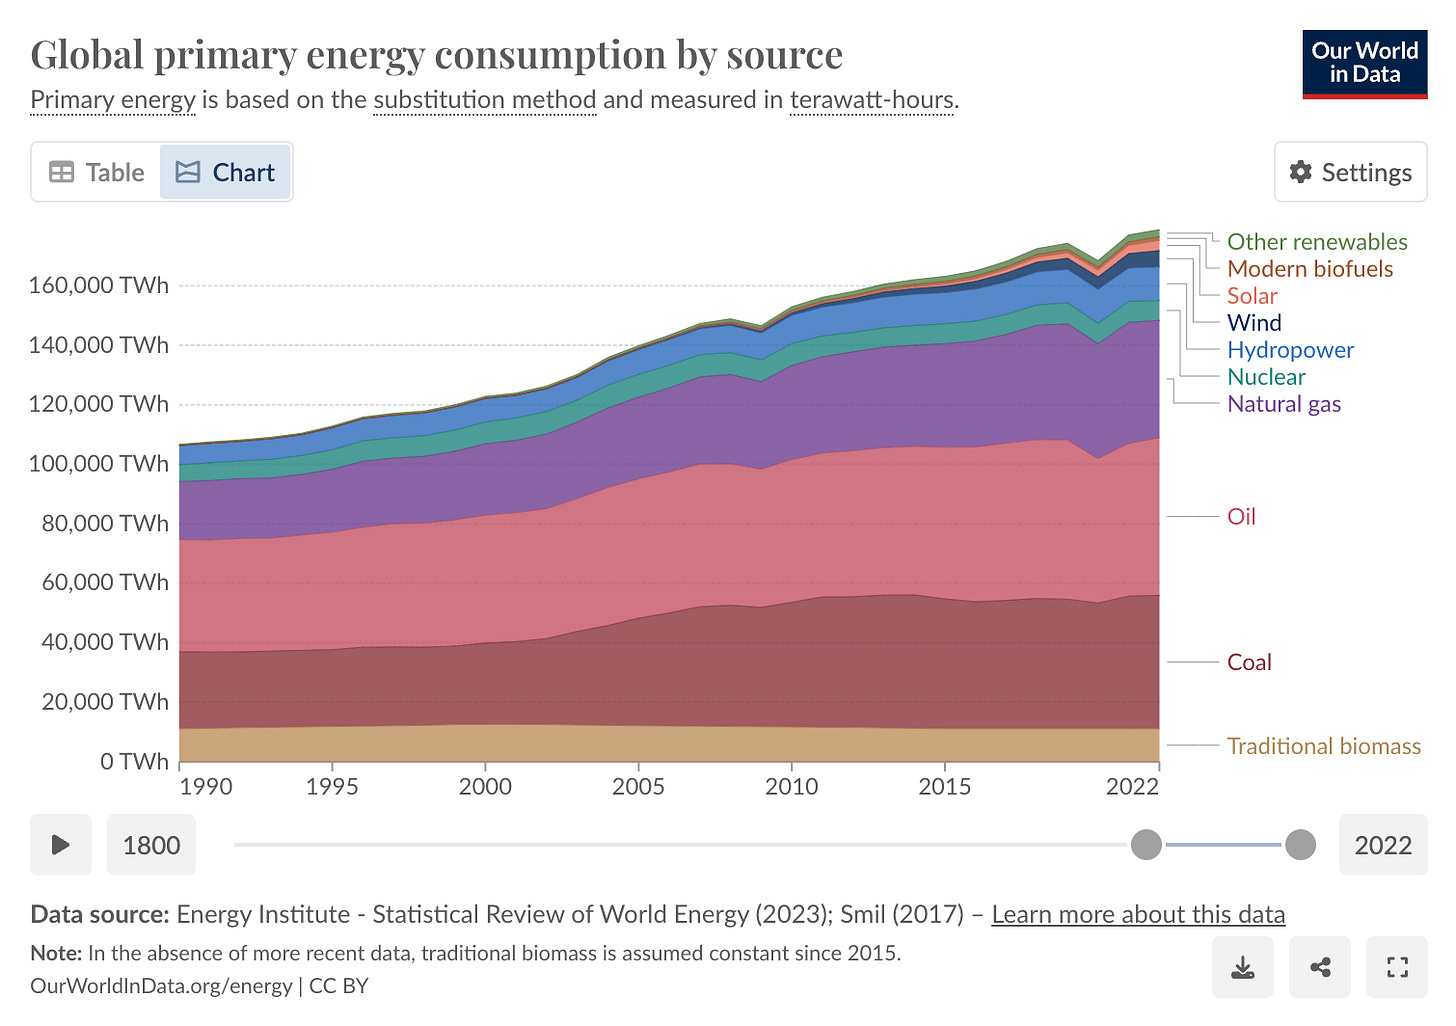
For example, from 2018 to 2022 our overall energy consumption grew by 6,385 TWh, a 3.7% - 4 year growth over 2014 to 2018 (which is below the average 4 year growth rate of ~7%). In the same period, Solar and Wind combined added 4,054 TWh, leaving a deficit of 2,331 TWh to be filled by other sources including both other renewables and fossil fuels.
But at some point the renewable energy output will outpace the overall energy consumption growth and lead to a drop in absolute fossil fuel consumption. This is an investigation and an attempt to figure out when that might happen.
Source: Our World in Data (Interactive Chart)
The Study:
In this study, I am looking at data from 1998 to 2022 (2022 was the most recent available data). I picked intervals of 4 years to average out growth a little bit. I also tried my best not to pick years with serious economic weaknesses like 2020.
However it must be noted that the period of 2020 to 2022 had significant economic weakness owing to Covid. But so did the 1998 to 2002 and the 2006-2010 period.
I usually don’t do this but i’ll give it away, renewables have started cannibalizing fossil fuels, not in absolute terms but that is coming too.
In this study, I’m doing a deep dive on:
1. Energy consumption by source in absolute terms
2. Growth rate in 4 year intervals of various energy sources
3. Each source’s contribution percentage towards total energy consumption
We will then also look at these data points by combining all the green energy, transition energy and fossil fuel sources.
For the purposes of this study, here is how I have allocated various energy sources:
Renewable Sources are:
Hydropower
Nuclear
Wind
Solar
Other Renewables
Transition Energy:
Natural Gas
Modern biofuels
Fossil Fuels are:
Oil
Coal
Traditional Biomass
I will primarily be focusing on Hydropower, Nuclear, Wind, Solar, Natural Gas, Oil & Coal when looking at individual sources.
When looking at combined data, I will be looking at ALL sources available.
70% of this article is charts because so it shouldn’t take that long to get through. I think charts are the best way to visualize what’s going on.
Having said that, you will see a few formatting errors in the chart which I blame on Google. I have been experiencing glitches across a lot of Google products over the last year or so and I’m too lazy to try and fix it manually because it does not change my story or make it any harder to read those charts. Let this be exhibit A, of why I’m bearish on Google.
If you like numbers more, then here is a link to the Google sheet with data.
Oil in absolute terms (TWh)
We can see that oil’s growth in absolute terms has slowed down in recent years and saw a dip in 2022. I have argued in the past that we were in a recession in 2022, so the drop could have something to do with that. But 2022 was the most recent year of data we have, so I wanted to keep it (especially given how fast renewables are growing).
In absolute terms, oil, as energy consumption by source, is still lower than what we had in 2018 and 2019.
Coal in absolute terms (TWh)
Coal saw rapid expansion in the first decade of the century but that has slowed down since 2014.
Natural Gas in absolute terms (TWh)
Natural Gas on the other hand has been growing consistently. Natural Gas is arguably a transition fuel.
On average, coal-to-gas switching reduces emissions by 50% when producing electricity and by 33% when providing heat.
Source: International Energy Agency
That explains the growth of Natural Gas as the world races towards renewables.
Hydropower:
Hydropower has been on a steady climb, nothing too fancy.
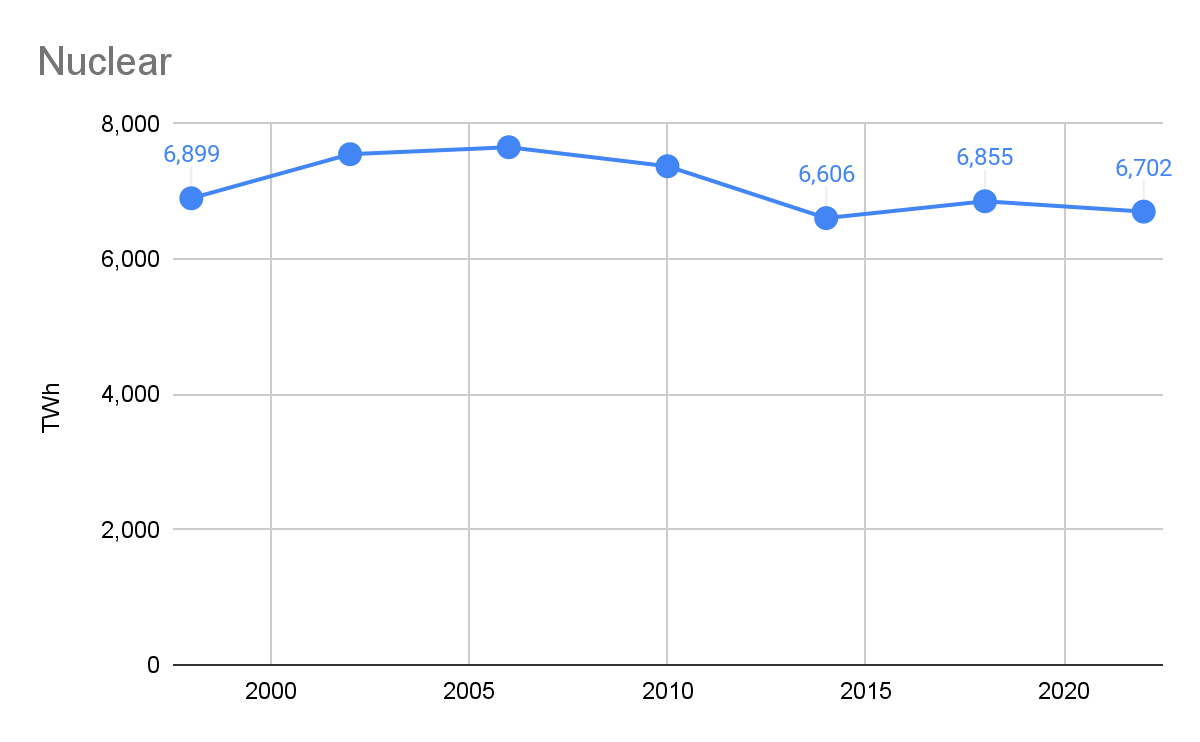
Nuclear:
Nuclear is a disappointing chart but that might change soon.
Wind:
Wind Energy has taken off like an airplane and continues to grow. However, it is still off a very small base and made up only 3.04% of all energy consumed by source.
Solar:
Solar is going ballistic! Solar too is coming off a small base and now makes up 1.93% of all energy consumed by source. But growing very very fast.
Now let’s compare 4 year growth rates:
Oil:
Oil saw its first drop in growth rate in the last 4 years but again that period encompassed a recession, the covid pandemic and China being weak. So I don’t think this is a clean read of drop in oil as an energy consumed by source. So yeah, it dropped but with an asterisk.
Coal:
Coal was weak between 2014 and 2018 and has recovered a little bit in 208-2022. At best, this tells me that we can’t conclude a clear decline in usage of Oil or Coal based on charts so far. It has not been growing like it did in the past but it also has not been falling off a cliff, yet.
Natural Gas:
Still Growing but slower in previous 4 year periods. Given that Natural Gas’s growth rate also dropped so much in 2018-2022 almost confirms that the drop we saw in oil was also impacted by global economic weakness and it is not clear so far if renewables have started cannibalizing fossil fuel sources of energy based on data so far.
Hydropower:
Hydropower’s growth is definitely slowing and I think this is more secular than the slowness we see in oil and coal because it peaked in 2002-2006 and has seen consecutive 4 year periods of drop from 2014.
Nuclear:
Clearly the most disappointing chart of all. Nuclear has true potential to provide clean energy at scale. In fact I don’t think we can ever go completely renewable without Nuclear in the mix.
Wind:
Wind is still growing very fast but the growth rate is decelerating. As the base grows larger, the growth rate is bound to come down. But it is still important to note that between 2018 and 2022, wind still grew 63.38% compared to 2014-2018. All previous charts you saw had sub 5% growth in that time period. So wind is still growing very fast.
Solar:
Solar, same as wind, is growing very fast but the growth rate is decelerating. Small base that grew 126.4% between 2018 and 2022 compared to 2014-2018. Double the speed of wind.
And now, let’s look at the various sources as a % of consumption:
Oil:
In this chart, you can see a clear cannibalization of oil as a source of energy. While Oil is growing on an absolute basis, increasingly it is becoming a smaller and smaller percentage of our total energy consumption. That trend line looks to be going only in one direction.
Coal:
Interestingly we don’t see the same drop off in coal. Instead coal looks more steady as a % of overall energy consumption.
Natural Gas:
As expected, natural gas has been growing steadily as the world looks at it as a transition energy source. Until we can have green energy infrastructure built out completely (likely with Nuclear in the mix), Natural Gas is going to continue to be part of the equation.
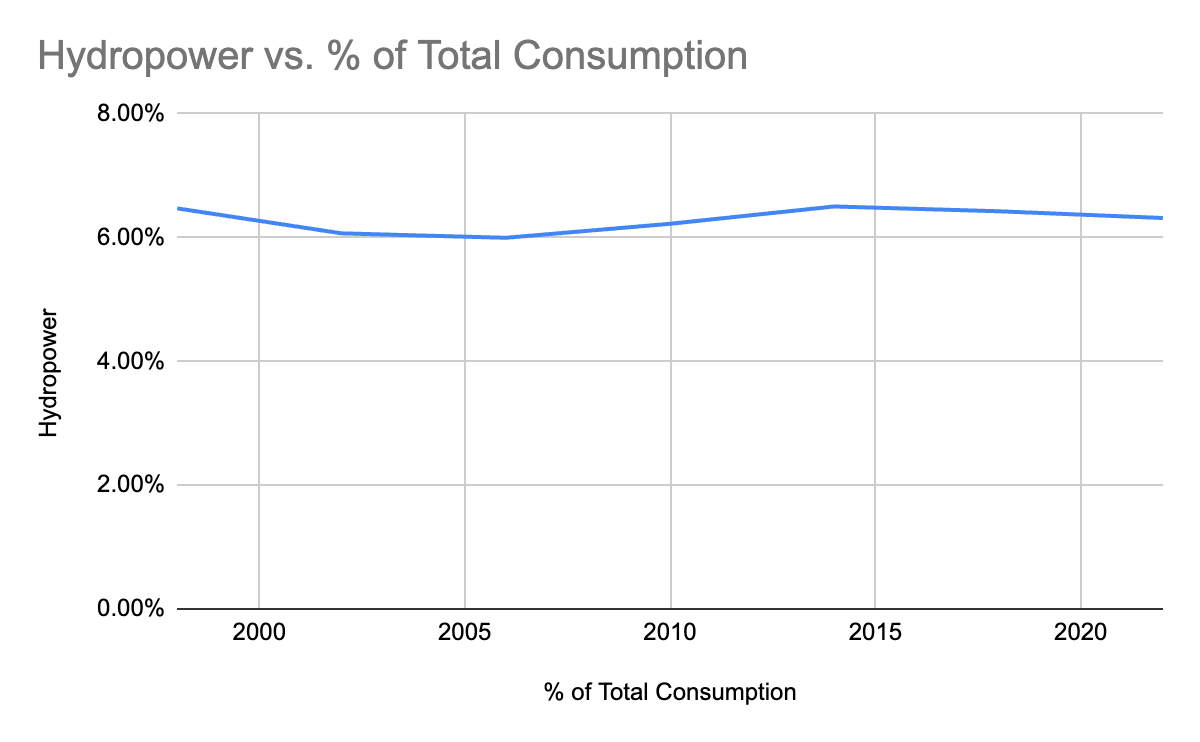
Hydropower:
Nothing to see here.
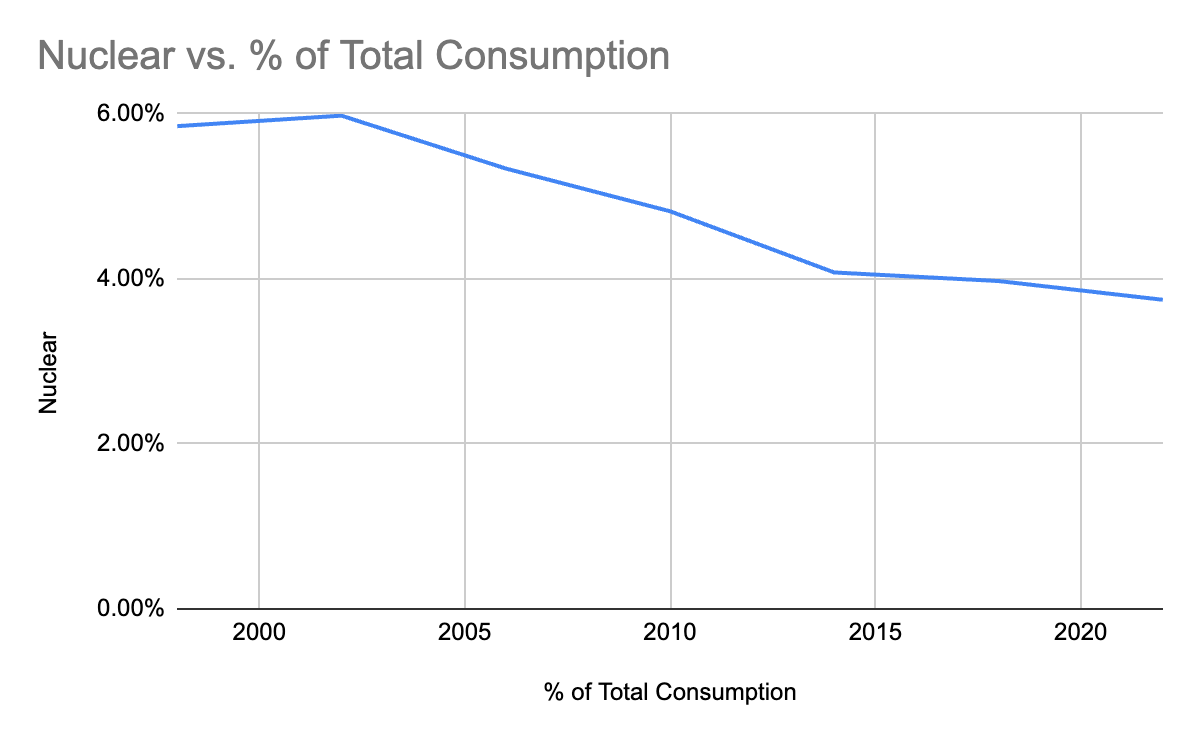
Nuclear:
Disappointing but change is coming. If you’ve followed Alpha Coverage, you’ll know what’s been going on with Nuclear. If not, you’re in luck. More on that later.
Wind:
Once again, this is where things start getting interesting. As you can see Wind has continuously been adding to the over energy mix and made up just over 3% of all energy consumed between 2018-2022.
Solar:
A hockey stick chart, going up into the right. Just below 2% of the overall energy mix, solar is rapidly growing to offset more and more fossil fuels.
Conclusion:
Based on the charts above, especially the oil, wind and solar as % of total consumption gives me a much clearer perspective that wind and solar are indeed cannibalizing oil. The overall energy consumption has grown at an average of 7% in the 4 year periods between 1998 and 2022. So as long as Wind and Solar continue to grow faster than the 7%, they will continue to cannibalize fossil fuel sources and at some point ‘contribute’ to a drop of Fossil Fuels in absolute terms.
Between 2021 and 2022, overall energy consumption grew from 177,057 TWh to 178,899 TWh which is approximately 1% growth in a year.
During the same duration, Wind went from 4,852 TWh to 5,488 TWh which is a 13.1% growth and solar went from 2,772 TWh to 3,448 TWh is a 24.4% growth in a year.
Cannibalization is happening and it looks like it will continue to happen.
If it is not completely clear already then let’s take a look at a few more charts comparing the combined fossil fuels, combined transition fuels and combined green fuels.
Combined Data:
Absolute Terms:
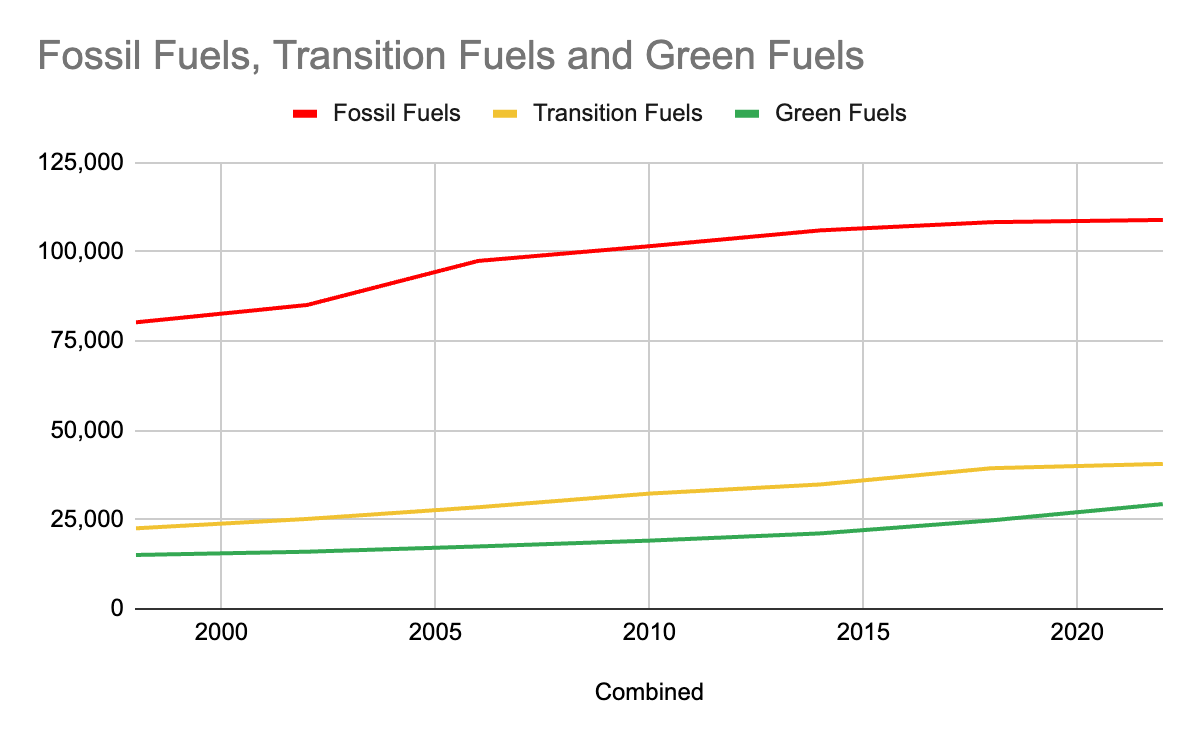
As you can see, Fossil fuels still make up most of the energy we consume but the growth has started to taper off and at some point it will start going down in absolute terms.
You can also see that green fuels have accelerated their growth in recent years and will likely take out transition fuels in a few years (if not faster) and Fossil Fuels in a couple of decades (if not faster).
As the green line continues to inflect higher it will ‘cause’ Fossil Fuels to start dipping.
4 Year Growth Rates:
In terms of growth rate also we can see that Renewable Energy is the only one showing any kind of sustained growth. Once again, some of this drop in growth rate could be because of the recession we experienced but the fact that Renweables continued to grow is a great sign and makes me very bullish. It shows that the renewable energy is a secular investment (minus the impact of interest rates :p)
As a % of consumption:
And finally the very clear drop off by percentage contribution for oil and green energy gaining ground. This is the cleanest chart showing the cannibalization of Fossil Fuels.
When will the growth of Solar + Wind outgrow our annual energy growth?
See math here (All blue labels are calculations and estimates, everything else is hard data).
Based on my math, somewhere between 2030 & 2034.
Between 2030 & 2034, I expect Wind and Solar to provide a combined 42,313 TWh of energy, 16,406 TWh higher than in 2026-2030 period. The overall energy consumption between 2030 & 2034 would be 219,159 TWh, a growth of 14,338 TWh over 2026-2030.
I expect the 16,406 TWh incremental growth coming out of Wind and Solar alone to completely offset the overall growth in energy consumption 14,338 TWh by 2034.
I used a diminishing growth rate for Solar and Wind to do this calculation. The 4 year growth rate of overall energy consumption was kept at 7% (based on data since 1998).
Please take note that this is only Wind and Solar, I did not include other renewable energy sources in this calculator, nor does it take into consideration Nuclear or Hydrogen.
This calculation is also based on past data and does not take into consideration any underlying fundamentals for any of these energy sources.
Nuclear is growing:
A couple of years ago, I was telling my friends that the end state of Nuclear Power will be a key ring sized reactor that you can carry in your pocket but it has enough juice to power your entire house.
Just this month, Chinese company Betavolt recently announced a nuclear battery smaller than a coin that produces power for 50 years without needing to charge.
Source: Yahoo Finance
I don’t know how much I trust that claim considering it is coming out of China but directionally, I believe that Nuclear and hence Uranium is going to continue to grow and accelerate.
Here are a few headlines pulled from my free weekly newsletter Alpha Coverage to substantiate my argument, because the data we earlier does not show any growth in Nuclear, yet:
U.S. finalizes $1.1B in aid to keep open California's last nuclear power plant - Seeking Alpha News Article - Jan. 17, 2024
Uranium producers jump as DoE seeks contract bids for domestic production - Seeking Alpha News Article - Jan. 09, 2024
World's top uranium producer warns of supply shortages over next two years - Seeking Alpha News Article - Jan. 12, 2024
Sizzling nuclear stocks rally to new 52-week highs across the board - Seeking Alpha News Article - Sep. 25, 2023
Nucor, Helion to develop 500 MW nuclear fusion power plant - Link to Seeking Alpha News Article - Sep. 27, 2023
Uranium names turn lower as world's top producer plans to end output cuts - Seeking Alpha News Article - Sep. 29, 2023
Uranium demand continues to rise substantially since last month - Seeking Alpha News Article - Sep. 15, 2023
Uranium is in short supply, pushing up prices and mining stocks - Seeking Alpha News Article - Sep. 14, 2023
Southern's Vogtle Unit 3 enters commercial operation, the first new nuclear unit built from scratch in more than 30 years - Seeking Alpha News Article - Aug. 1, 2023
EU countries strike deal on renewable energy law that backs nuclear - Seeking Alpha News Article - June 16th, 2023
Uranium stocks rally as Senate committee OK's aid for advanced nuclear reactors - Seeking Alpha News Article - June 1st, 2023
Over the last 10 months, Alpha Coverage has covered Nuclear and Uranium across 13 news articles and 3 opinion pieces. I even mentioned it in one of my opinion pieces.
If you had purchased $CCJ at open on June 1st, when Alpha Coverage first published about Nuclear, you’d be up ~42% (63% annualized).
My Positioning:
Please refer to my opinion pieces titled “The Next Bull Run” & ENPH & FSLR: Solar Powerhouses for my thesis on ‘why’ I own these stocks.
Sentiment on renewables is terrible which I think makes it a good time to accumulate. I wanted to make a joke about how the only sector worse is pot stocks but surprise surprise pot stocks have been perking up for months, in case you didn’t notice.
Here is the ‘what’ I hold:
(1. All targets below are allocation targets - how much money I wanna put in, 2. Averaging up means the current price is above my buy price and averaging down means it’s below).
Nuclear: I am no expert in Nuclear, just like most investors, I see the writing on the wall and am trying to gain exposure. My instruments to gain exposure have been CCJ 0.00%↑ , URNM 0.00%↑ and URA 0.00%↑ . I am currently adding to my CCJ 0.00%↑ position averaging up (51% to target which was raised recently) and holding URNM 0.00%↑ and URA 0.00%↑ (100% to target)
Solar: My top picks on solar are ENPH 0.00%↑ (112% to target, averaging down & looking to rebalance at break even) & FSLR 0.00%↑ (47% to target, averaging up).
Wind: In Wind I continue to add to FAN 0.00%↑ (70% to target, averaging down). I still haven’t put in a lot of time into wind energy and am therefore still sticking to an ETF for exposure.
EVs: I am still very bullish on TSLA 0.00%↑ (95% to target, averaging up). Given the most recent earnings reports, I am a little more measured on Tesla stock in the short term. I don’t see Tesla doing well until one of two things happens 1. The Federal Reserve cuts interest rates or 2. TSLA starts trading on 2025 numbers (which should happen by summer 2024). Having said that, I continue to average up into $TSLA and will continue to do so until I hit 100% allocation target. I am also bullish on Tesla’s battery business.
Battery Tech: Still think ENVX 0.00%↑ (100% to target) is going to be the next generation battery we see in our everyday devices. And eventually it will make way for solid state batteries from the likes of SLDP 0.00%↑ (160% to target) & QS 0.00%↑ (185% to target). Averaging down on both and looking to rebalance at break even. I like SLDP 0.00%↑ more than QS 0.00%↑ because QS 0.00%↑ has a 13x higher market cap than SLDP 0.00%↑ . Also, SLDP’s strategy is compatible with existing battery manufacturing infrastructure which is a huge plus.
Here are some top, most recent headlines in the world of Battery Tech.
Solid Power recently entered into three new agreements with SK On worth $50 Million -Link to Seeking Alpha News Article - Jan. 16, 2024
QuantumScape also had a win with Volkswagen battery test - Link to Seeking Alpha News Article - Jan. 04, 2024
Enovix Corp establishes $1.2 bln high-volume manufacturing facility in Malaysia - Link to Reuters News Article - Nov. 16, 2023
Materials: I am continuing to dollar cost average into ALB 0.00%↑ (140% averaging down & looking to rebalance at break even) which is my number one lithium play. This is a change from my precious article where I had recommended LIT 0.00%↑ . I am now looking to sell LIT 0.00%↑ owing to China exposure. Holding for now, I think this is the absolute worst time to sell anything lithium related.
COPX 0.00%↑ (100% to target) is still my preferred way to play Copper. However, I also have a position in FCX 0.00%↑ which gives me a slightly higher beta than the ETF.
Hydrogen: Still think Hydrogen has a role to play in decarbonization but not seeing any clear leadership in Hydrogen for now.
With the exception of Nuclear, the underperformance in all renewable energy related names is an interest rate story. And while I don’t think we will go back to near 0% interest rates anytime soon, we will definitely see a lower borrowing rate a year from now. And as the market takes that into consideration, some of these stocks have potential to deliver 10x return over the next decade.
Borrowed Conviction Rarely Works
Past performance is no guarantee of future results.
The ideas discussed in this article should not be constituted as investment advice.
I reserve the right to change my mind if the facts change.
Disclosure: We own positions in some/all of the tickers mentioned in this article.










Global power demand seen surging nearly a third by 2035 - Rystad
Power demand worldwide will continue to rise rapidly, jumping ~30% over the next decade, as the continued push for electrification, buildout of data centers, and the need to heat and cool buildings increases, energy research firm Rystad Energy predicted in a new report this week.
Rystad forecasts oil demand will peak by the early 2030s, with growth in the use of natural gas also slowing down, which will make renewable energy - especially solar - critical for meeting new demand, as the report estimates renewables will supply 55% of total electricity by 2035, up from 34% this year, with the rest from nuclear and fossil fuels.
https://seekingalpha.com/news/4512640-global-power-demand-seen-surging-nearly-a-third-by-2035-rystad
"Saudi Arabia's government ordered state oil company Saudi Aramco to stop plans to expand its oil production capacity."
"Analysts said the move could reflect a change in Saudi Arabia's outlook for global oil demand and may be followed by Aramco curbing capital investment."
Did i predict this?
Source: https://www.nasdaq.com/articles/us-oilfield-firms-slip-as-aramcos-lowered-capacity-target-sparks-spending-cut-concerns